To better understand how snotels work and what a typical year looks like, we’ll look at historic snotel data at one site.
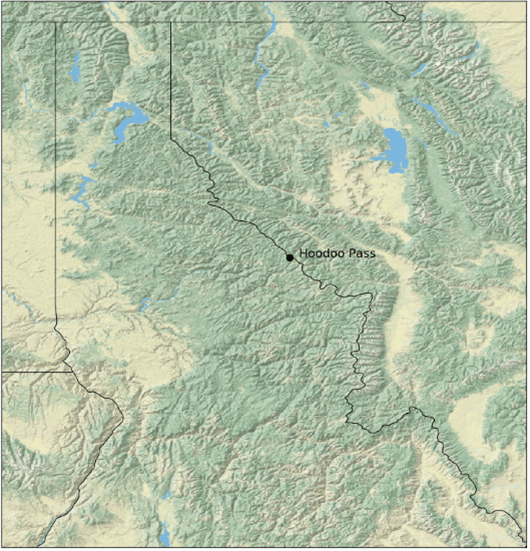
Snotel site number 530, Hoodoo Basin, lies at 6,050 ft. on the Montana/Idaho border in the northern Bitterroot mountain range. I chose to demonstrate snowpack using this snotel because it has a particularly long record (began recording in 1966), it gets tons of snow (it’s in the 95th percentile of all snotels) and because I have a long history with skiing in the area.
It sits just below Hoodoo Pass, a popular winter snowmobile destination and summer hiking paradise just north of the Great Burn Wilderness Study Area. This beautiful area has unlimited ski potential with a snowmobile, but road access snows over in early to mid-December most years and doesn’t melt out again until May or even June. In fact, the snotel did not melt out until July 29th after the extremely snowy winter of 2010-2011, so the prime ski season here is either very early before the road snows over, or very late when it melts out again.
I first skied here in November of 2013 and returned in December to camp for my first ever winter-camping trip. I skied there in July the following year, went back for another ski camping trip the following December, and have skied there almost every year since.


An Average Year at Hoodoo Basin
It’s important to remember that a typical year at Hoodoo Basin may look very different from a typical year elsewhere. A snotel in Oregon or Alaska may have a shorter or longer season but get just as much snow. Different elevations also reach their max at different times. Furthermore, Hoodoo Pass gets tons of snow, maxes out at more than 100” of settled base most years, and has an average max SWE of 44.6”. That’s nearly four FEET of water trapped in the snow annually. Many famous ski areas are near snotels in the 90th percentile of SWE, so this might be somewhat representative of a typical year at a ski area that’s known for getting hammered.
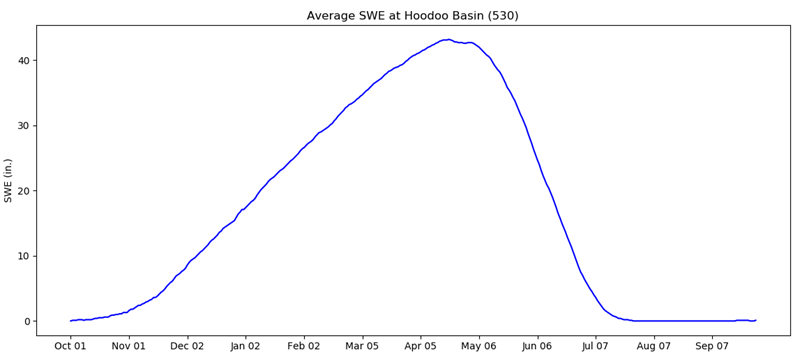
Hoodoo Pass typically starts really accumulating snow in mid-November, peaks on April 25th, and melts out in early July (July 1st on average). It hits a max SWE of an average of 44.6” (which translates to an average maximum snow depth of 122”).
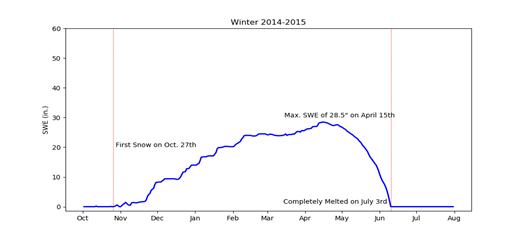
Of course, the smooth graph of the daily averages doesn’t provide a good picture of any given year. Even an “average” year will have weeks below and weeks above average depending on when storms hit. To illustrate this point, I’ve shown an average, above average, and below average year at Hoodoo Basin below.
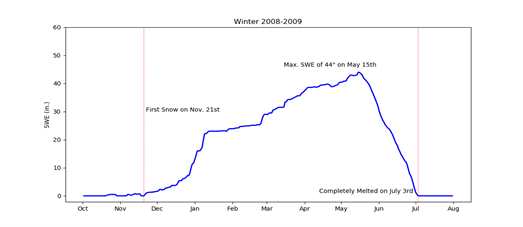

These SWE graphs are useful for any snow scientist, but SWE doesn’t easily translate to snow depth in the average skier’s mind. If a storm drops 2.0” of SWE, is it an epic day? That depends! If the snow is 5% water and 95% air (5% density snow), then those 2.0” of SWE fell as 40” of cold smoke powder. If the snow is 25% density, then the storm dropped 8” of cream cheese that might be impossible to turn in. The figure below should help show the comparison between SWE and snow depth for winter 2008-09.

One thing that is immediately noticeable is that after a storm, the snow compresses and causes the graph to spike, whereas SWE accumulates until it reaches a peak late in the spring and then quickly drops off. The density of the new snow occasionally shows in the graph. A storm in February caused a large spike in snow depth but barely any increase in SWE. It snowed 13” with a 0.8” increase in SWE (6% density). Conversely, the storm that kicked off the season started with 5” of snow and 1.0” of SWE (20% density). The maximum snow depth is also usually reached much earlier in the year than maximum SWE. That’s because snow compresses long before it melts.

The maximum annual SWE varies wildly, with the lowest max around 22” and the highest of nearly 90”. Really bad years are one-fourth the SWE of the really good years! There is a clear decline in Max. SWE when taken over 50 years, but the variability is too great for a clear trend over 30 years.
Hoodoo Basic Compared to Other Areas
This snotel gets more snow than 95% of all snotels. I’ve attached some figures of Hoodoo Basin compared with other regions and other snotels that might be more typical depending on what region you live in.
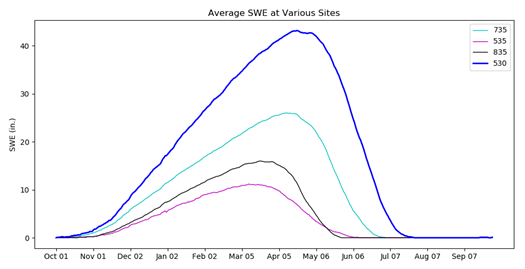
Site 535 (Humboldt Gulch) near Lookout Pass is in the 25th-percentile of snotels, site 835 (Twelvemile Creek) in the Central Bitterroots is in the 50th-percentile, and site 735 (Savage Pass) in the Selway/Lochsa area is in the 75th-percentile of snotels. Interestingly, Twelvemile Creek melts out earlier (on average) than Humboldt Gulch even though it gets more snow and has a colder spring.
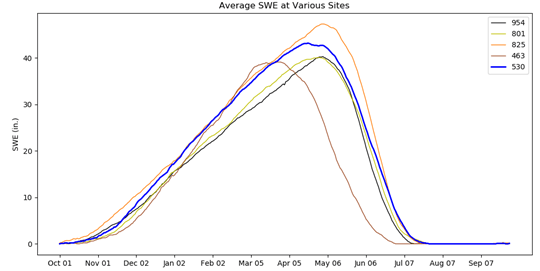
Site 954 (Turnagain Pass in AK), site 801 (Summit Lake in OR), site 825 (Tower in CO), and site 463 (Echo Peak in CA) are all in the 90th percentile of snotels. They all have similar profiles except for Echo Peak in California. Echo Peak hits its peak and melts out much earlier than the others. Summit Lake and Tower hit their peak later than Hoodoo Basin but have lower peaks.
Hopefully I provided a complete picture of how snotels work and what an average year at an especially snowy snotel looks!
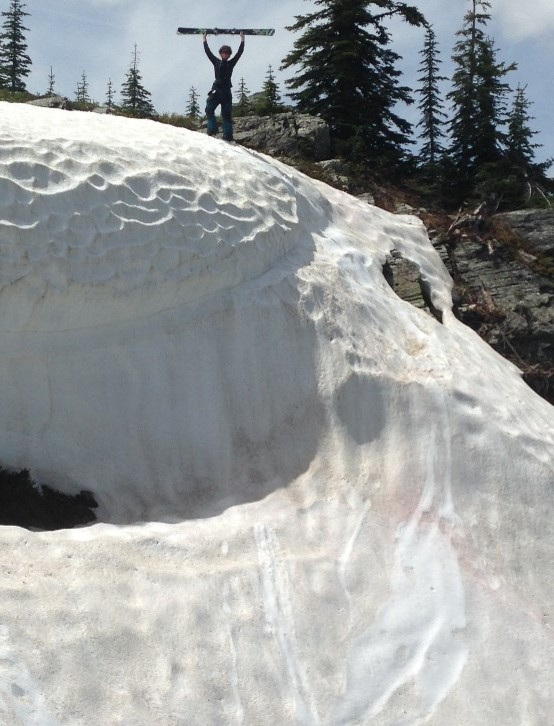
(Right): (July 2014) Tons of snow and great skiing to be found near the snotel at Hoodoo Basin in July. That’s a big cornice to drop onto firm summer snow!
